
Sage 200 Tips – Price Book Validation
12th January 2017
Act! CRM 2017 European Summit
15th February 2017Business Intelligence for Sage 200, or ‘BI’ as it’s commonly referred to, is an incredibly powerful tool. BI is also very flexible and this will come as no surprise to those that use it regularly. However, for those that haven’t had any training and rarely use BI, making amendments to reports can be daunting.
There are 82 BI reports in the latest version of Sage 200. These reports cover a wide range of business-areas, from financial reports such as Balance Sheet and Profit & Loss, to commercial reports such as Stock Item Profitability and Seasonal Sales Trends.
Sage 200 BI Report Layout tool
The Report Layout tool is central to the composition of BI Report Tables, and getting some practice with this tool is the key to achieving a better understanding of BI report design.

One of the first items we cover whilst providing BI training is how to restructure a BI table; to add, remove and change the columns and rows. Although the range of built-in reports is far-reaching, the ability to tweak the reports is fundamental to getting what you need from BI, so stay with me and I’ll show you how!
For the following example we’ll look at the Customer Analysis BI report. Within Excel, from your Sage BI toolbar select Report Layout and you will be presented with this tool.
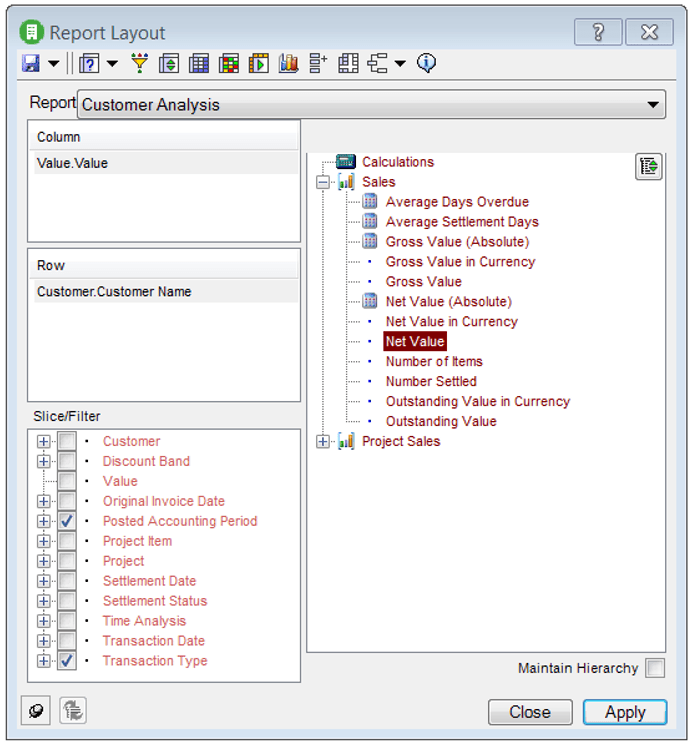
You can see that there is a section for Columns and a section for Rows. The variables that reside within these sections will determine which Rows and Columns are displayed within the data table.
In the above screenshot we can see that I’ve placed the ‘Customer Name’ variable into the Rows section, and the ‘Value.Value’ variable in the Column section. ‘Value.Value’ will almost always be present in the Columns or Rows section as this determines which value(s) will be outputted into the data table.
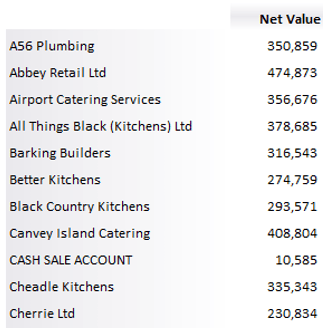
The items displayed in the section to the right will depend upon which variable you currently have highlighted from any of the three sections on the left. In the above screenshot I’ve highlighted ‘Value.Value’, and we can see in the section to the right that we’re only choosing to output ‘Net Value’ to the data table. Our report table currently appears like this:
Working with Columns & Rows
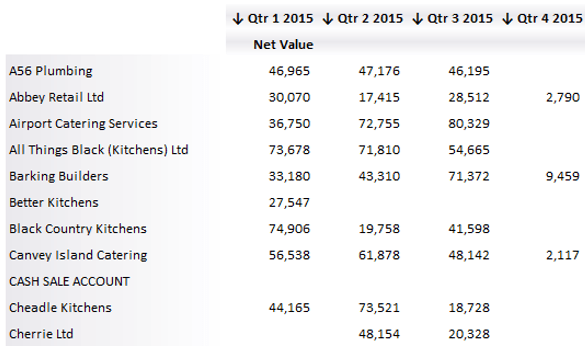
Let’s say we want to continue reviewing the Net Value for these customers just as we currently are, but split quarterly over 2015.
First you need to move the ‘Transaction Date’ variable into the Column section. Expand the ‘Transaction Date’ group within the Slice/Filter section to reveal ‘Transaction Date.Transaction Date By Calendar’, then drag-and-drop this into the Column section, above the Value.Value variable.
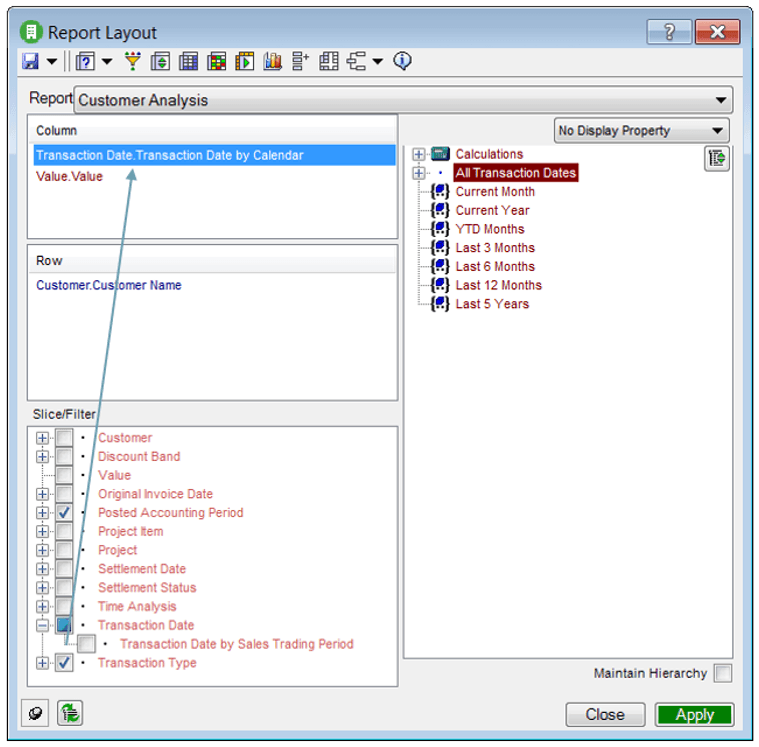
This will add the ‘Transaction Date’ set of columns to your table, but it won’t appear much different yet.
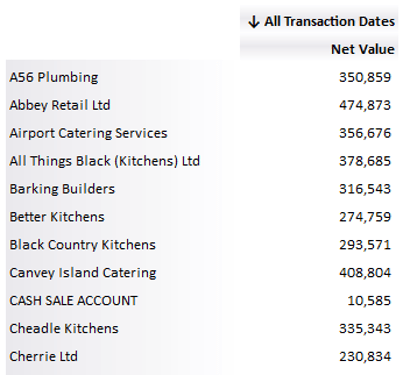
In order to specify which columns you’d like to display from this group, select the new ‘Transaction Date’ variable from the Column section which will in-turn populate the section to the right with everything available to you.
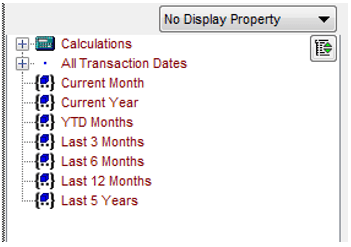
Select the ‘+’ symbol beside ‘All Transaction Dates’ to expand this group and the same again for the 2015 group, and then highlight each of the 2015 quarters by holding down either Shift or Ctrl on your keyboard.
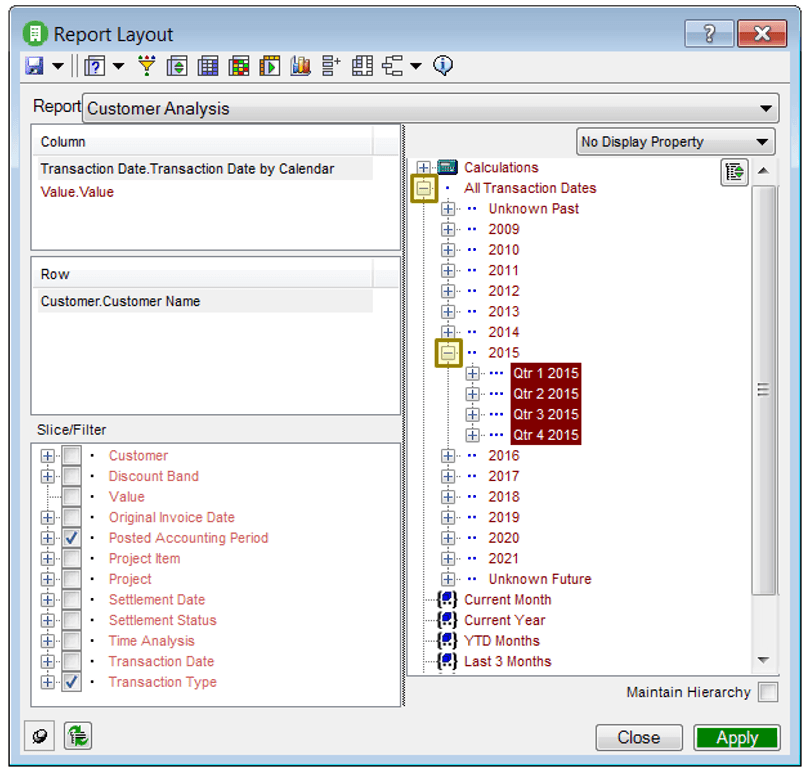
Click ‘Apply’ and your BI data table will update to reflect the changes you’ve made.
Spend a little time practicing with this Report Layout tool and you will start to feel comfortable designing your data tables.
Keep an eye out for future blogs from the team at AlphaLogix!
Our team of Accredited Sage 200 Product Specialists have many years of experience and are here to help, from initial consultation through to: development, implementation, training and on-going support.
If you would like any further information or a demonstration of Sage 200, please contact us:
Email: info@AlphaLogix.co.uk
Tel: 0845 259 3141

Kind Regards,
Richard Owens | Product Specialist


